macOS Agent Utility
The macOS agent includes a UI-based Agent Utility. The utility allows customers to easily troubleshoot by
- checking an endpoint status.
- viewing an endpoint cache.
- displaying the agent configuration.
- exporting logs.
It also offers UI-guided means to
- register the agent with the server.
- update the endpoint to retrieve the latest policies.
- request JIT Admin privileges.
Accessing the Agent Utility
To access the Verify Privilege Manager macOS Agent Utility, use any of the following methods.
Select the Agent Utility icon in the menu bar (if present) and select Agent Utility from the menu.
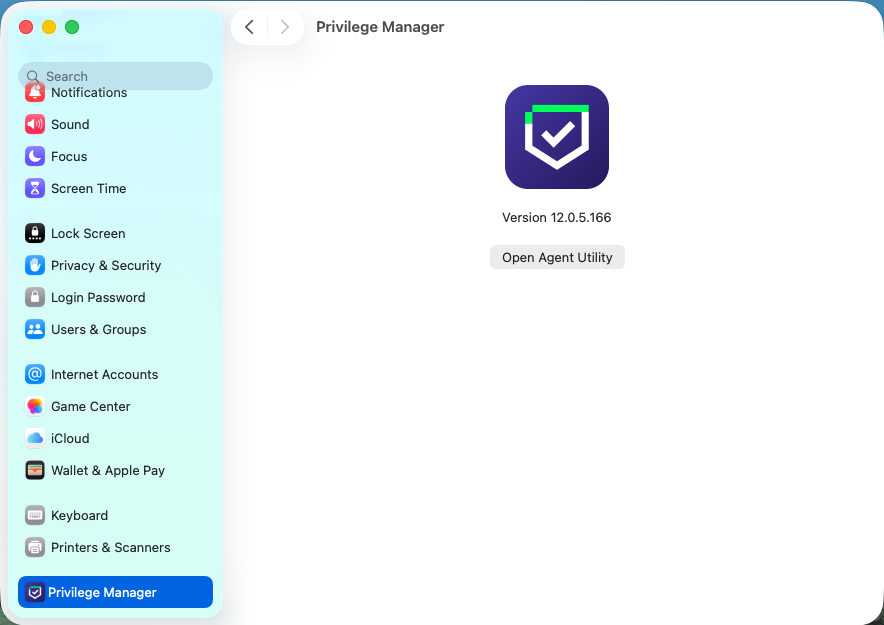
Open System Settings. Select Privilege Manager, then select Open Agent Utility.
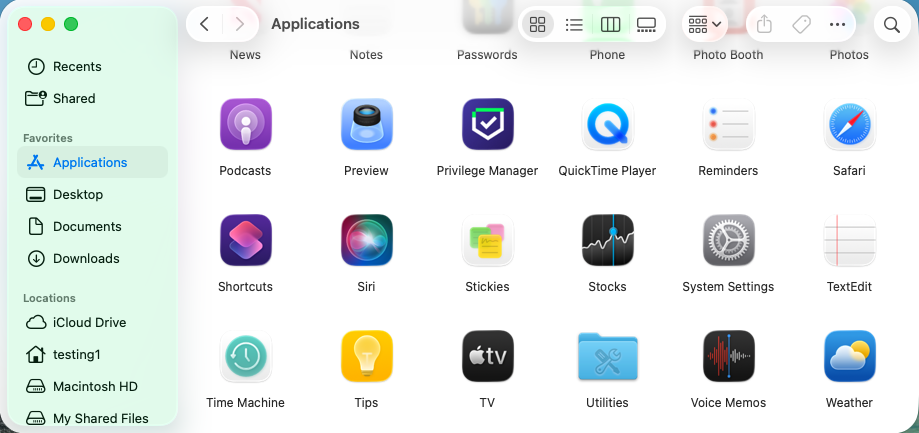
In the Finder, select the Applications folder and double-click the Privilege Manager icon.
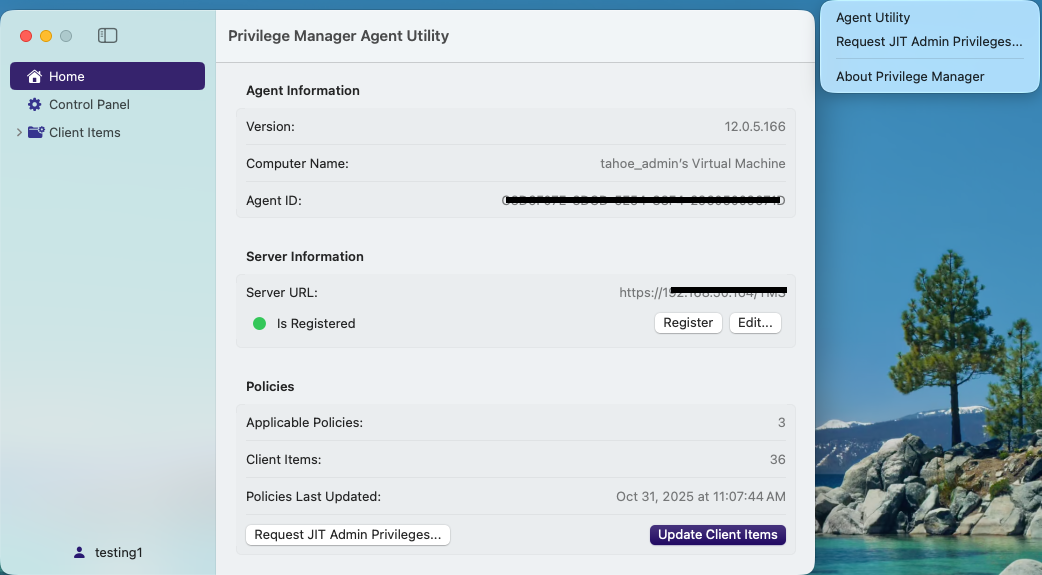
Home Tab
On the Home tab, Agent Information provides details like the agent version, computer's name, and agent ID.
Server Information lists the Server URL for the current agent registration. You can Register an agent or Edit an existing agent.
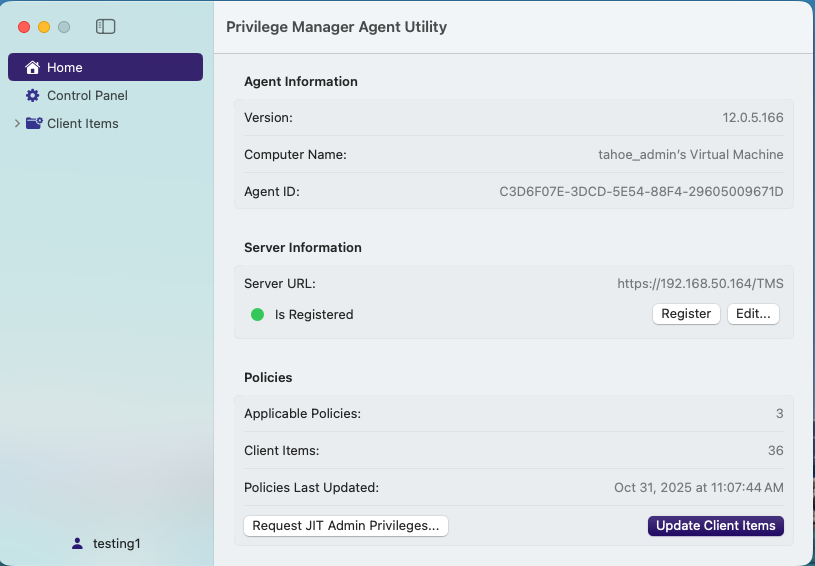
Policies displays the number of applicable policies and client items cached. It also provides the date/time stamp of the last update.
Use Update Client Items to trigger a client item update. When Update Client Items is selected, and if there are updates to applicable policies or policies are added to the endpoint, the Policies Last Updated time stamp will change to reflect the time when the last change occurred.
The date/time stamp does not reflect when the last update client items command ran, the date/time stamp only updates when there was an actual change on the endpoint.
Refer to Just In Time (JIT) Administrator Privileges - macOS to learn about Request JIT Admin Privileges.
Control Panel Tab
The options on the Control Panel tab provide maintenance and message logging features.
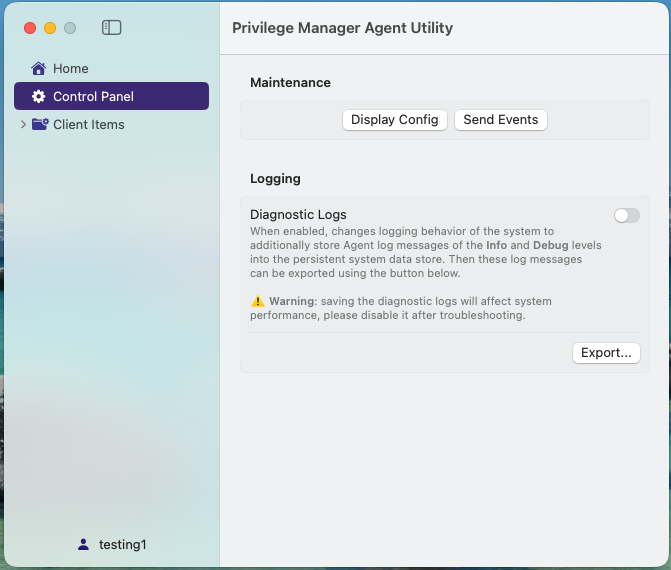
Maintenance
The Display Config button shows the current agent configuration values.
Select Send Events to enforce the event uploader process to find any unsent policy events and try to send them to the Verify Privilege Manager server immediately. These unset policy events reside in the folders:
-
/Library/Application Support/Delinea/Agent/Transfer/ReadyEvents that are ready to be sent.
-
/Library/Application Support/Delinea/Agent/Transfer/ErroredEvents that haven’t been sent due to some error.
Logging
When the Diagnostic Logs toggle is disabled, the system only stores the Fault, Error, and Default levels of the Agent log messages by default. The Info level log messages are present in the system memory but can be erased (e.g., on system reboot). Therefore, when performing the log export with disabled diagnostics, a log archive will contain only a limited amount of log messages (mostly the error messages which allow to troubleshoot the obvious bugs).
When the Diagnostic Logs toggle is enabled, the system will additionally store Agent log messages with Info and Debug levels into the persistent system data store. Having the messages persist allows the Agent to collect them later when performing an export. The system's optimized log storage has certain limitations - it's around 1GB in size for all the processes in the system. If there is no room for new log messages the oldest logs are deleted and replaced with the newest ones.
Saving the diagnostic logs will degrade system performance, please disable it after troubleshooting.
Select Export to perform an export of Agent logs from the persistent system storage. The resulting *.logarchive bundle is compressed using the Apple Archive format. The *.zar file can be unpacked using the default macOS un-archiver by double clicking the file. The unpacked log archive bundle can be opened via the Console app (double click the bundle or drag-and-drop it onto the Console icon in the Dock) or by using the log command in the Terminal. These two system tools allow the Agent logs to be inspected and filtered. For example, the ability to perform time filtering in the Console app, is shown.
Refer to Filtering Logs for Troubleshooting to learn more about filtering logs.
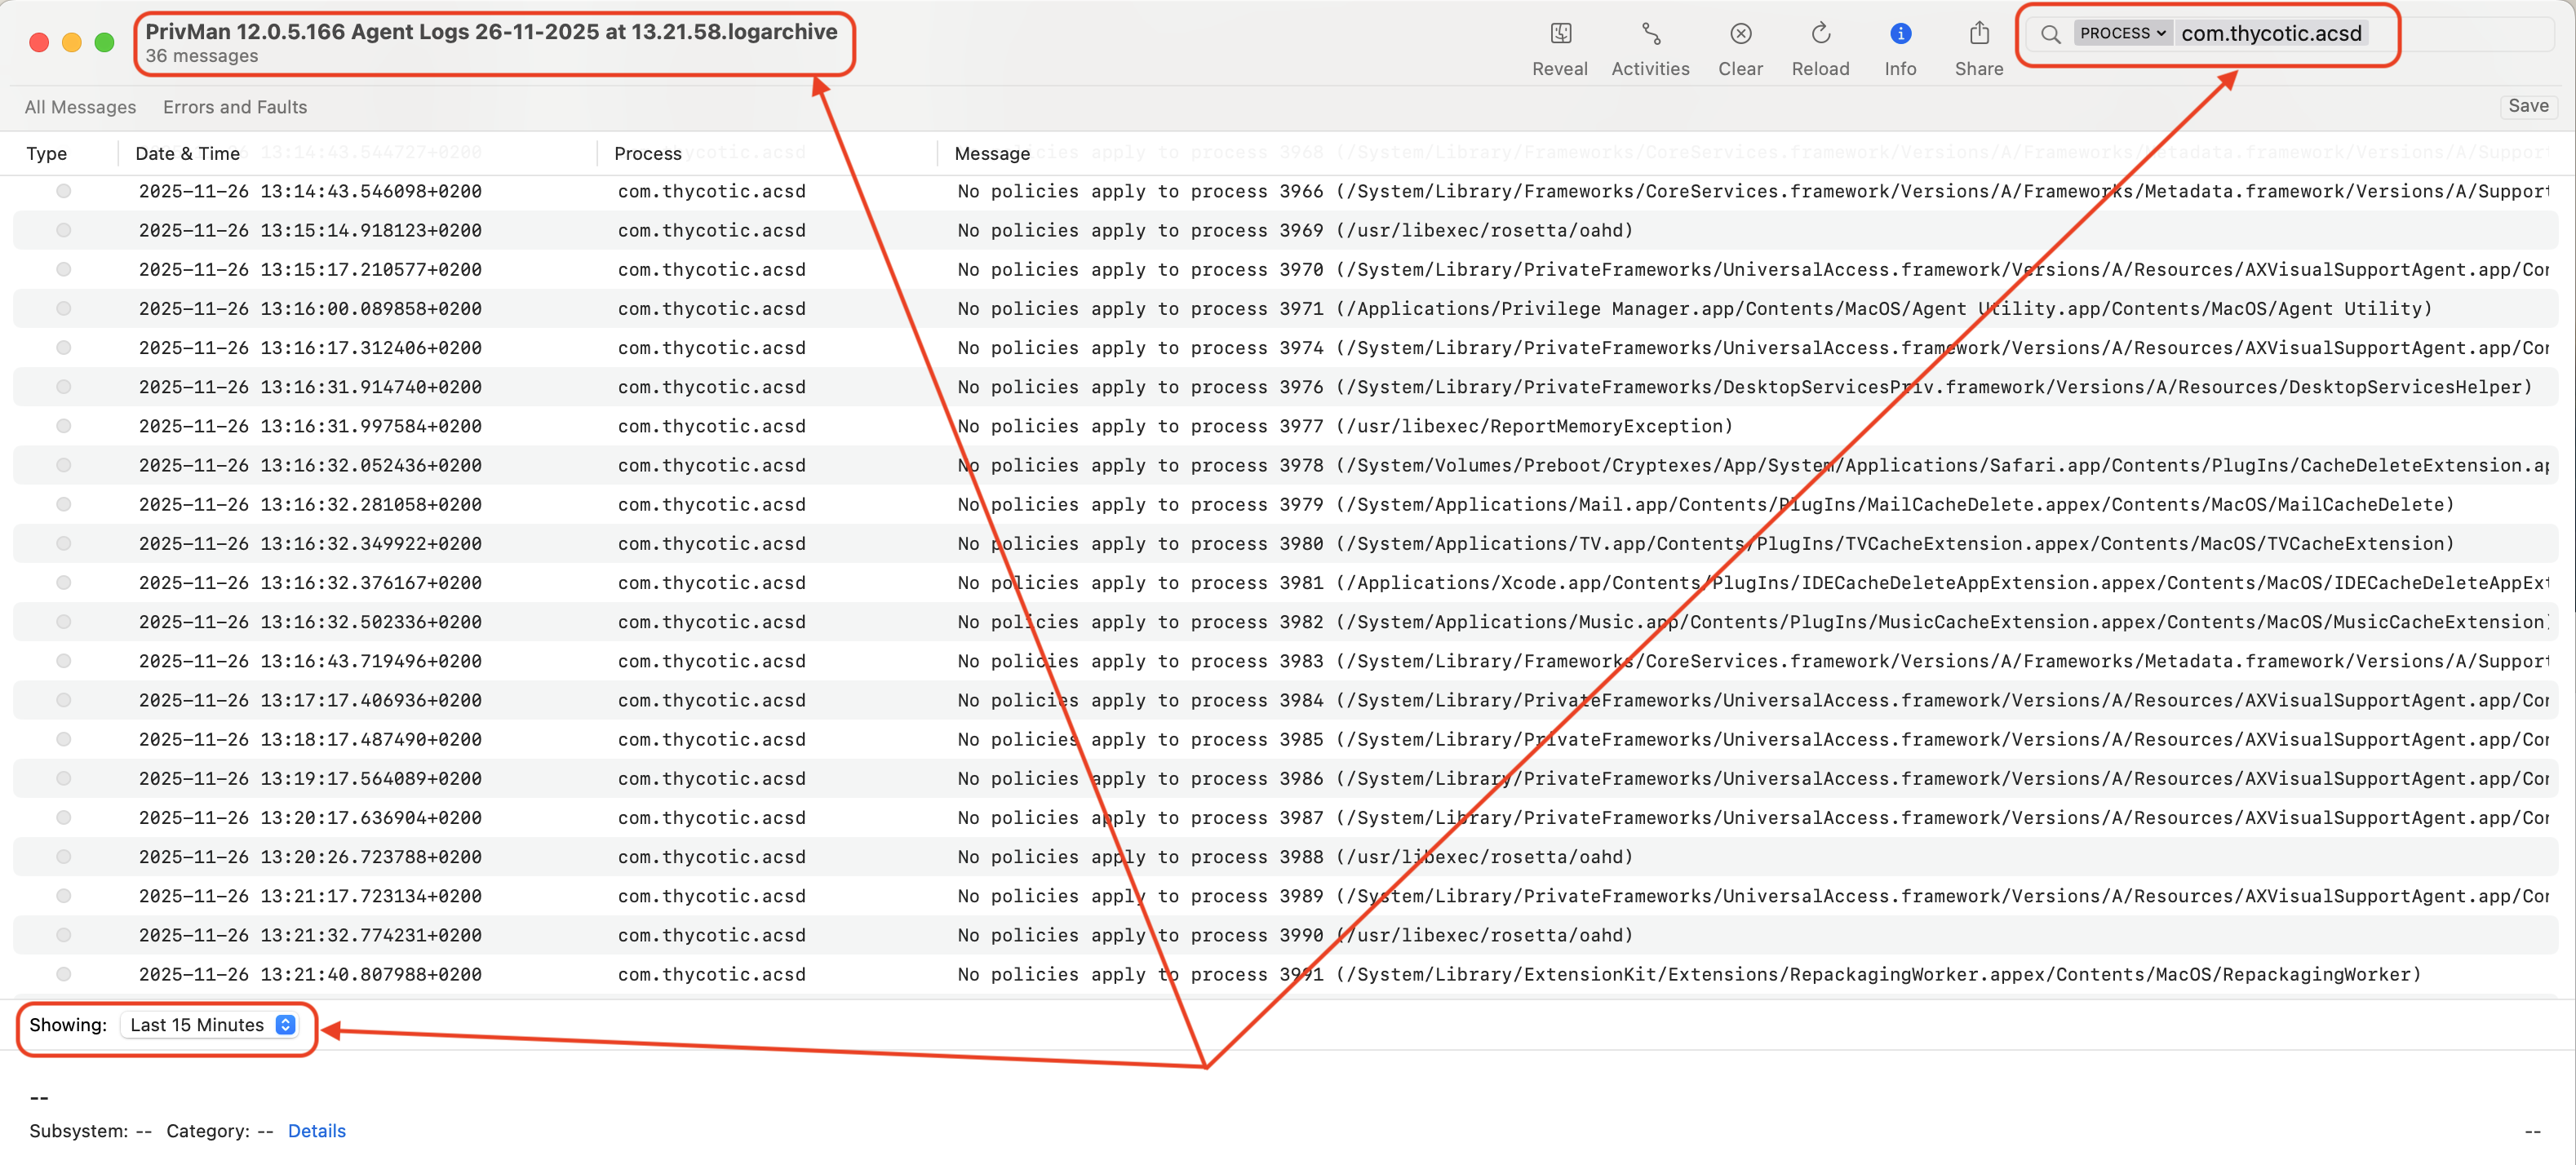
Another way that the logs can be viewed is the log command-line tool. This tool can convert the logs to a text format using the following command in the Terminal.
log show --archive /path/to/Privman 12.0.5.166 Agent Logs 28-10-2025 at 0.37.14.logarchive > ~/path/to/output_text_file.log
In general, troubleshooting workflow should be:
-
Enable Diagnostic Logs.
-
Reproduce the issue. It isn't necessary to reproduce it immediately. For example, if the issue is sporadic, it may take a few days to replicate.
-
Export the Agent logs.
-
Disable Diagnostic Log to restore the system performance.
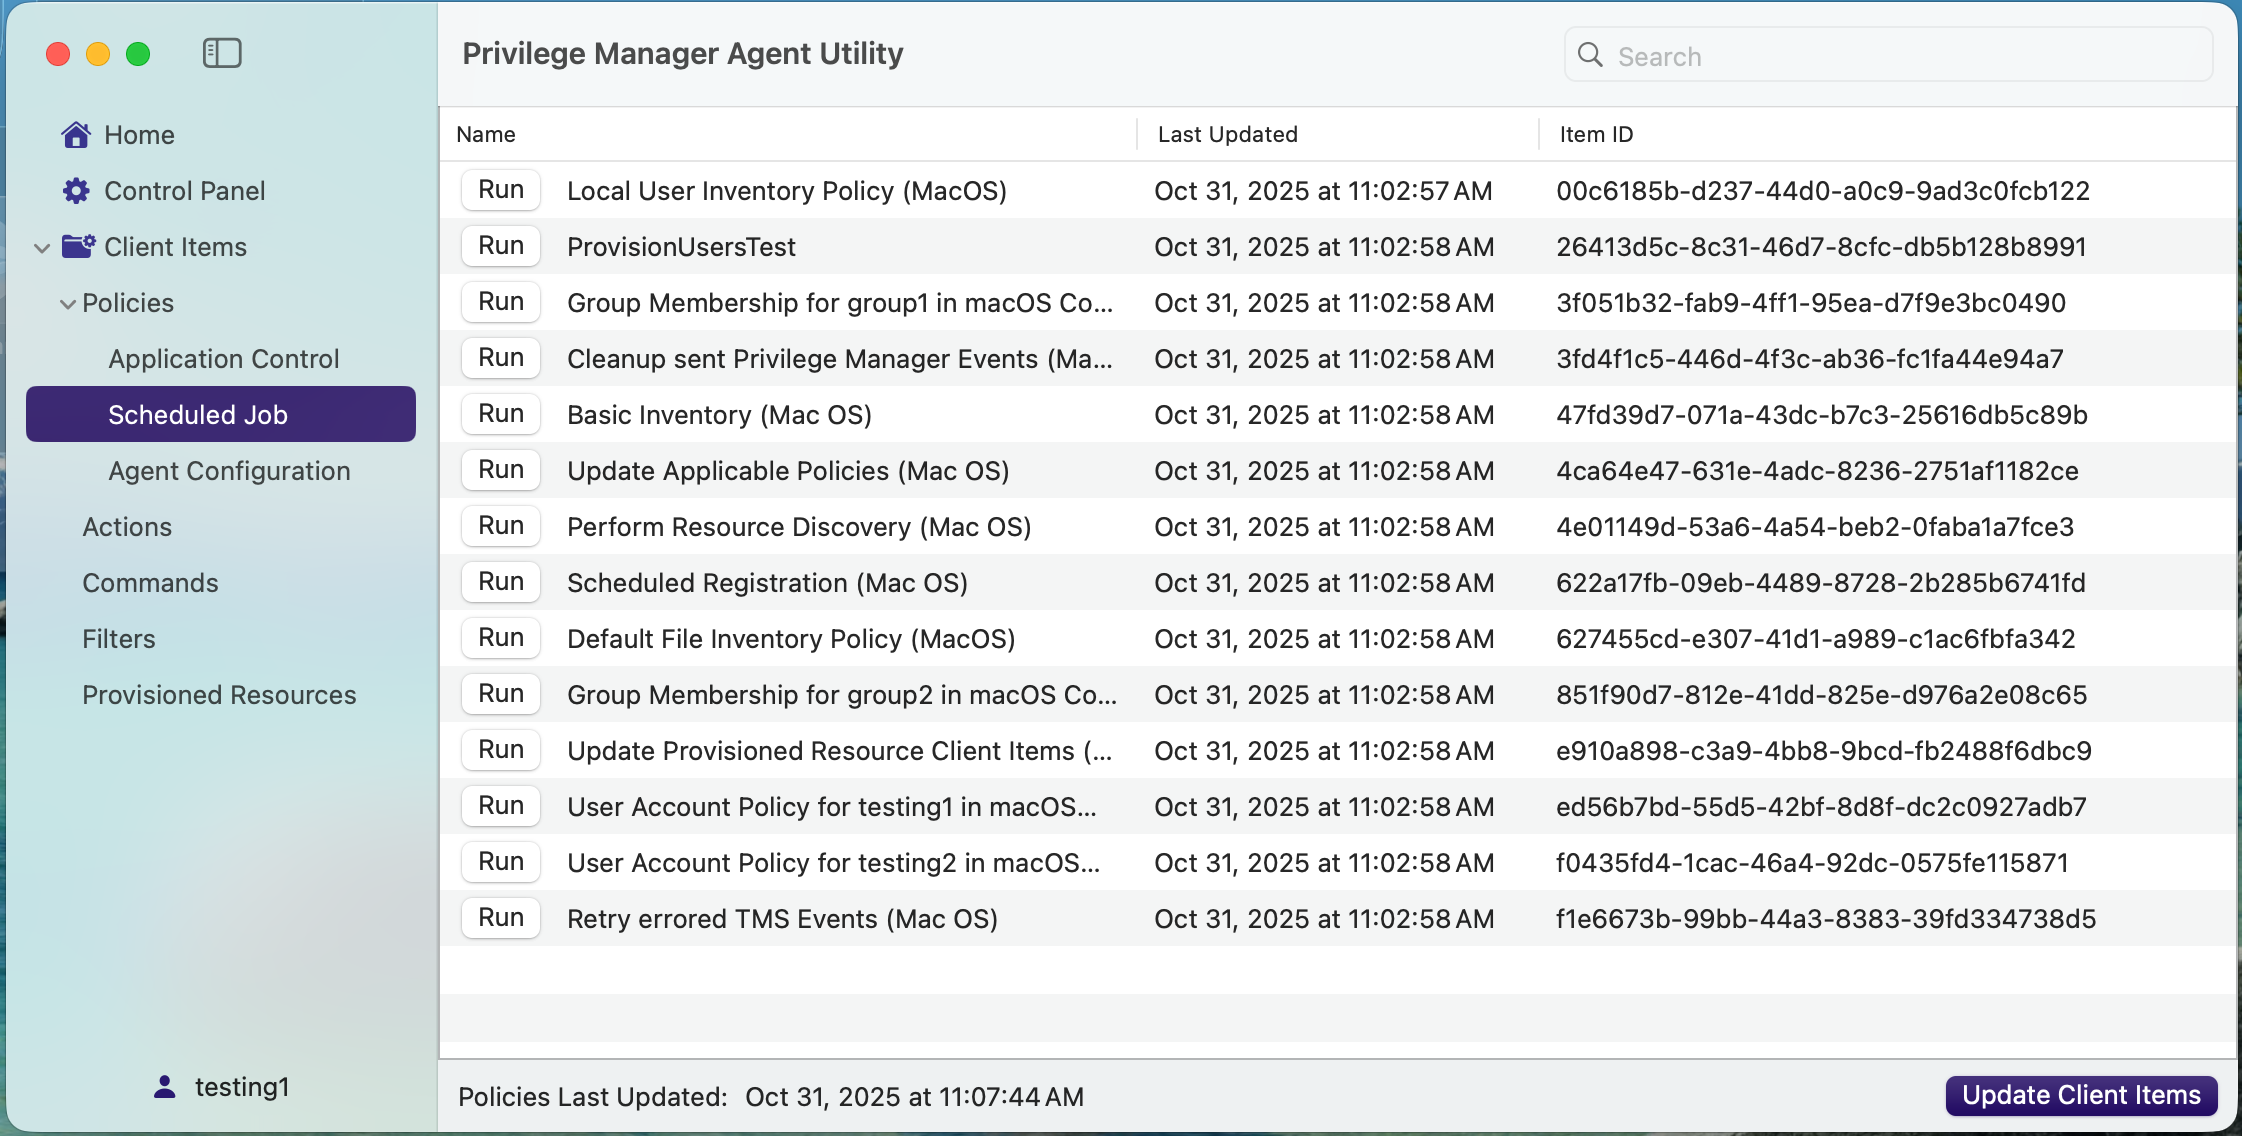
Client Items Tab
The Client Items tab provides an overview of all client items on the endpoint. The client items are grouped into the following categories.
-
Policies
-
Application Control
-
Scheduled Job
-
Agent Configuration
-
-
Actions
-
Commands
-
Filters
-
Provisioned Resources
Select Policies, then select Scheduled Jobs. Each item in the list shows the item ID and when it was last updated. Click Run next to the job's name to run that Scheduled Job.