Verify Privilege Manager
copied to clipboard
Home Page
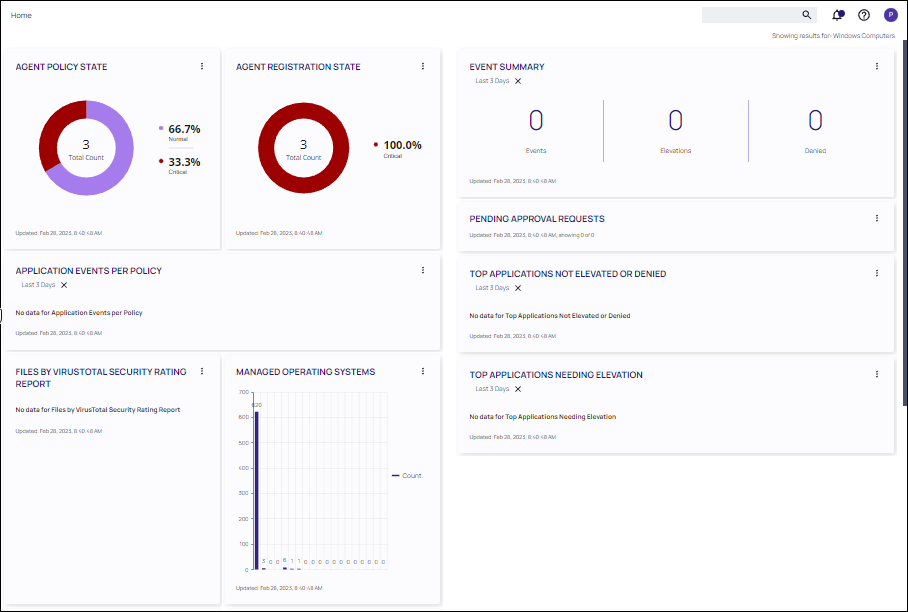
The Home page consists of a dashboard with elements displayed for a selected computer group. The Home page includes actionable dashboard elements as well as the gateway to the two major components of Verify Privilege Manager, Local Security and Application Control. These are available from their respective tiles.
Adjusting Computer Group Display
To update the display to a specific computer group, select that group in the Showing results for drop-down.
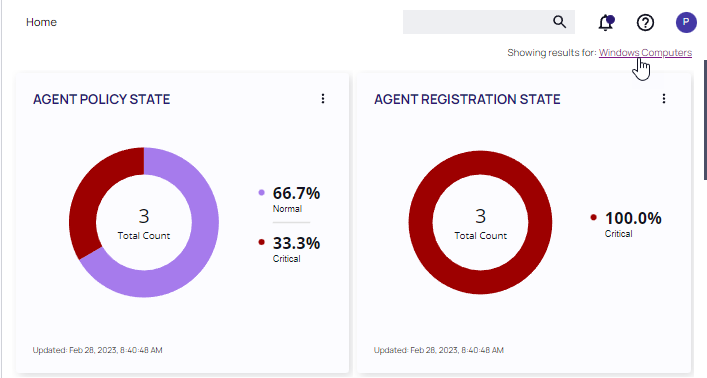
AGENT POLICY STATE displays counts for agents in the currently selected computer group, and does not directly relate to overall license usage. Therefore, this tile should not be used for a 1:1 comparison with the Utilization Summary in the Product Licenses report.
Viewing Component Details
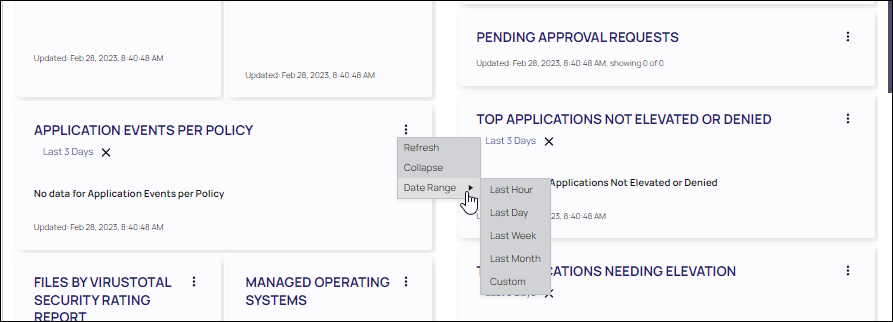
Much of the text and other content on the page is clickable. The link under it will help you drill down to more detail. (Although some links, here and on other UI pages, are shown in blue, you should not assume that the absence of blue font implies there is no link. The best way to discover links is to hover over the content to find out if it is clickable.) The set of three little vertical dots, in the upper right corner of each tile, provide options to manipulate the tile.
Configuring Gauges and Reports
Many aspects Verify Privilege Manager can be customized. The gauges displayed on the Home page of the Verify Privilege Manager console and at many other pages can be removed and others can be added. The same with the Reports Options on the Reports page. Basic customization is available by clicking the ellipses on each gauge, and more configuration is available through the XML, however custom changes made via XML may be reverted upon future updates of Privilege Manager.
Gauges are used in Verify Privilege Manager to display the results of periodic configuration checks of the server and endpoints. Gauges allow reports and graphs to keep historical trend data, and speed up access in the console.
Gauges Available
Verify Privilege Manager currently has gauges published to track when an agent last communicated with the server, agents that have received all of their policies, agents that have a random password set, etc.
You can click the following gauges to drill down for more information:
- Agent Policy State
- Agent Registration State
- Application Event Counts by Publisher
- Application Events Per Policy
- Event Summary
- Files by VirusTotal Security Rating Report
- Managed Operating Systems
- Pending Approval
- Top Applications
- Top Applications Needing Elevation
- Top Applications Not Elevated or Denied
- Top Denied Applications
- Top Users
- Top Users Attempting to Run Denied Applications
Reports Available
After selecting Reports from the left navigation, you can click Select Report Options to change the reports that are visible. Some Reports offer the ability to filter by category of data such as policy, computer group, date range, or other criteria. See Reports for details.
Custom reports can be created, however this requires access to the Privilege Manager SQL tables to write queries. In order to import the queries to a Verify Privilege Manager Cloud instance, the query has to be signed by the IBM Security support team before it can be used. If you require assistance in creating custom reports, please contact IBM Security Professional Services.
In this Article